
7 Aug
2012
7 Aug
'12
6:02 p.m.
Hi Peter and others,
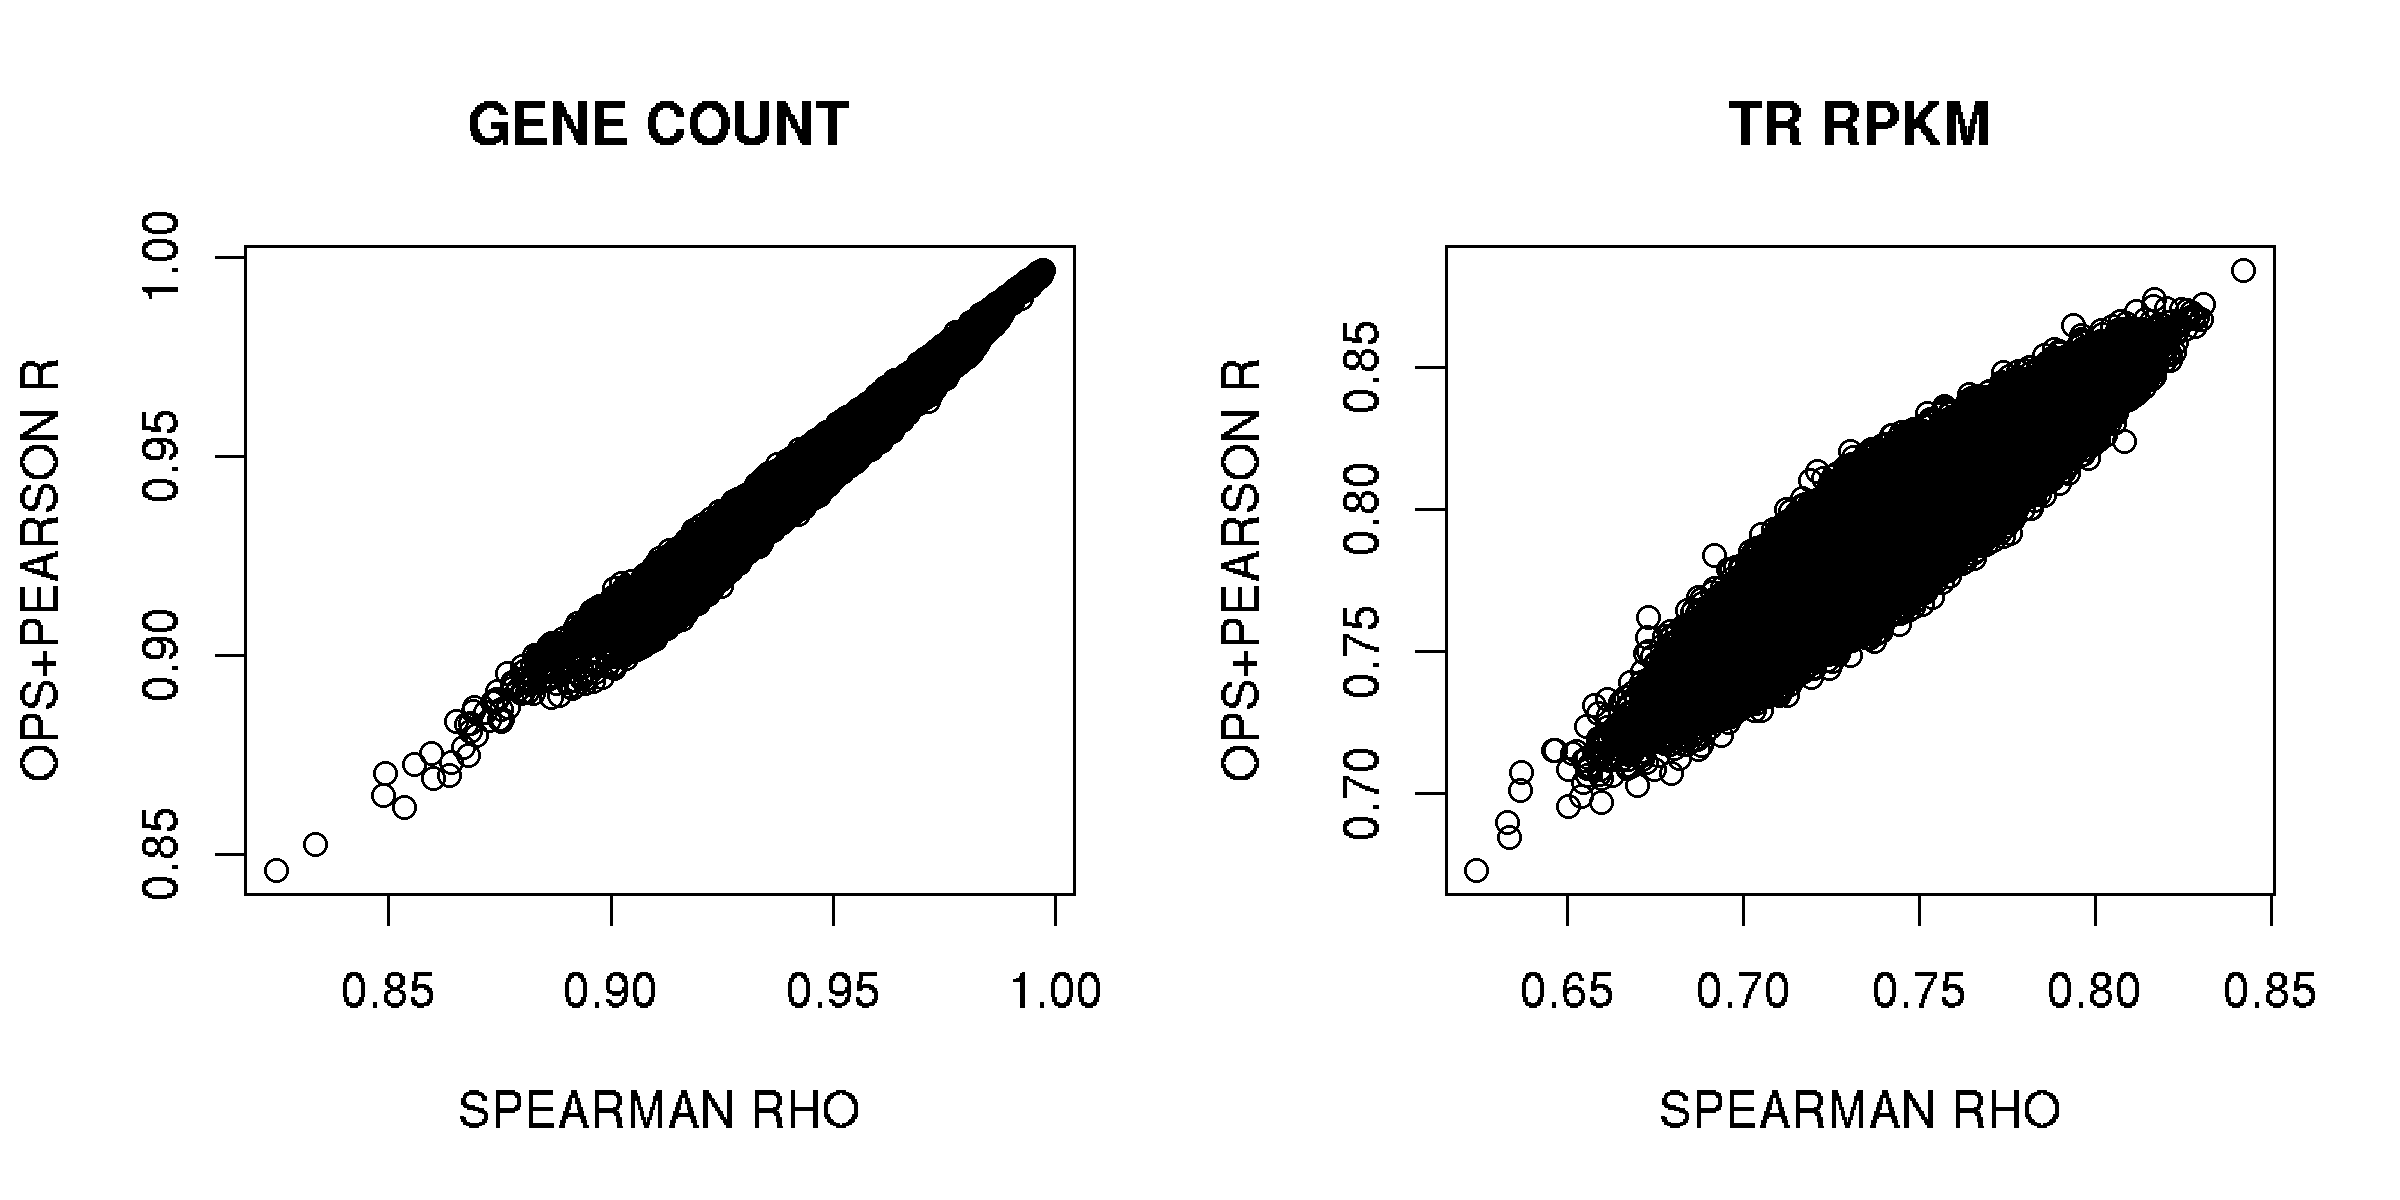
This looks good. In my analyses, I've calculated the matrices of
pairwise correlations using only exons/genes/transcripts (whatever the
quantification unit is) that are >0 in both samples. I don't know if
this matters much, but we should agree on Thursday what's the set of
exons/etc that we use to calculate the correlations.
I've done some comparisons of OPS+Pearson vs Spearman, and here are two
scatterplots - they give very consistent results. There's one plot of
all pairwise correlations, and another one of d-statistics (=median of
one sample's correlations against all others). In these plots I've
dropped the two expression level outliers, NA18861.4.M_120208_5 and
NA19144.4.M_120208_2.
Additionally, in case you don't already have these yourself, I just
uploaded the correlation matrices of all 667x667 samples, both Spearman
and OPS+Pearson correlations in
/upload/geuvadis/wp4_rnaseq/main_project/analysis_data/qc/correlation_matrices/
.
best,
Tuuli
Tuuli Lappalainen, PhD
Department of Genetic Medicine and Development
University of Geneva Medical School
CMU / Rue Michel-Servet 1
1211 Geneva 4
Switzerland
Tel. +41-(0)22-3795550
tuuli.lappalainen(a)unige.ch
On 8/7/12 10:26 AM, P.A.C._t_Hoen(a)lumc.nl wrote:
Dear all
We are all aware of the pitfalls of Pearson correlations on largely
skewed data. Micha mentioned in Barcelona the OPS (optimal power space
transformation package) that he developed. It worked very well to
determine correlations between samples, I believe. Attached some results.
Best
Peter
Dr. Peter A.C. 't Hoen
Center for Human and Clinical Genetics
LeidenUniversity Medical Center
Postal zone S4-P
PO Box9600
2300 RC Leiden
The Netherlands
phone: +31-71-5269421
fax: +31-71-5268285
e-mail: p.a.c.hoen(a)lumc.nl
_______________________________________________
Geuvadis_rna_analysis mailing list
Geuvadis_rna_analysis(a)lists.crg.es
http://davinci.crg.es/mailman/listinfo/geuvadis_rna_analysis